IMF...................................................WB................................................CIA
rank/measure.................................rank/measure........................................rank/measure
22/34,296.....................................20/34,254.......................................25/34,402
| Economy of Japan | |
|---|---|

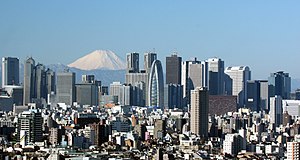
Financial centre in Tokyo
| |
| Rank | 3rd (nominal) / 4th (PPP) |
| Currency | Japanese Yen (JPY) |
| Fiscal year | 1 April – 31 March |
| Trade organisations | APEC, WTO, OECD, G-20, G8 and others |
| Statistics | |
| GDP |
$5.964 trillion (2012 est.) (nominal; 3rd)
$4.628 trillion(2012 est.) (PPP; 4th) |
| GDP growth | 1.9% (Q3 2013) |
| GDP per capita |
$46,736 (2012 est.) (nominal; 14th)
$36,266 (2012 est.) (PPP; 23rd) |
| GDP by sector | agriculture: 1.2%, industry: 27.5%, services: 71.4% (2012 est.) |
| Inflation (CPI) | 0.3% (April 2011)[1] |
| Population below poverty line | 16% (2010)[2] |
| Gini coefficient | 38.1 (2002) |
| Labour force | 65.93 million (2011 est.) |
| Labour force by occupation | agriculture: 3.9%, industry: 26.2%, services: 69.8% (2010 est.) |
| Unemployment | 4.6% (2011 est.)[1] |
| Main industries | among world's largest and technologically advanced producers of motor vehicles, electronic equipment, machine tools, steeland nonferrous metals, ships, chemicals,textiles, processed foods |
| Ease of doing business rank | 24th[3] |
| External | |
| Exports | $788 billion (2011 est.) |
| Export goods | motor vehicles 13.6%; semiconductors 6.2%; iron and steel products 5.5%; auto parts 4.6%; plastic materials 3.5%; power generating machinery 3.5% |
| Main export partners | |
| Imports | $808.4 billion (2011 est.) |
| Import goods | petroleum 15.5%; liquid natural gas 5.7%; clothing 3.9%; semiconductors 3.5%; coal 3.5%; audio and visual apparatus 2.7% |
| Main import partners | |
| FDI stock | $161.4 billion (31 December 2010 est.) |
The economy of Japan is the third largest in the world by nominal GDP, the fourth largest bypurchasing power parity and is the world's second largest developed economy. According to the International Monetary Fund, the country's per capita GDP (PPP) was at $35,855 or the 22nd highest in 2012. Japan is a member of Group of Eight. The Japanese economy is forecasted by theQuarterly Tankan survey of business sentimentconducted by the Bank of Japan.
Japan is the world's third largest automobile manufacturing country, has the largest electronics goods industry, and is often ranked among the world's most innovative countries leading several measures of global patent filings. Facing increasing competition from China and South Korea, manufacturing in Japan today now focuses primarily on high-tech and precision goods, such asoptical instruments, Hybrid vehicles, and robotics. Beside the Kantō region, the Kansairegion is one the leading industrial clusters and the manufacturing center for the Japanese economy.
Japan is the world's largest creditor nation,generally running an annual trade surplus and having a considerable net international investment surplus. As of 2010, Japan possesses 13.7% of the world's private financial assets (the 2nd largest in the world) at an estimated $14.6 trillion. As of 2013, 62 of the Fortune Global 500 companies are based in Japan.