IMF..................................................WB.....................................................CIA
rank/measure...................................rank/measure...................................rank/measure
41/15,569........................................31/15,856....................................41/16,171
Before the Second World War, Estonia's economy was based on agriculture, but there was a significant knowledge sector, with the university city of Tartu known for scientific contributions, and a growing industrial sector, similar to that of neighbouring Finland. Products such as butter, milk and cheese were widely known on the western European markets. The main markets were Germany and the United Kingdom, and only 3% of all commerce was with the neighbouring USSR.
The USSR's forcible annexation of Estonia in 1940 and the ensuing Nazi and Soviet destruction during World War II crippled the Estonian economy. Post-war Sovietization of life continued with the integration of Estonia's economy and industry into the USSR's centrally planned structure. Before the war, Estonia and Finland had about the same GDP per capita, but by 1987, capitalist Finland's GDP per capita was 14,370 USD, while communist Estonia's GDP per capita was around 2,000 USD.
After Estonia moved away from Communism in the late 1980s and became an independent capitalist economy in 1991, it emerged as a pioneer of the global economy. In 1994, it became one of the first countries in the world to adopt a flat tax, with a uniform rate of 26% regardless of personal income. Between 2005 and 2008, the personal income tax rate was reduced from 26% to 21% in several steps. Estonia received more foreign investment per capita in the second half of the 1990s than any other country in Central and Eastern Europe. The country has been quickly catching up with the EU-15, its GDP per capita having grown from 34.8% of the EU-15 average in 1996 to 65% in 2007, similar to that of Central European countries. It is already rated a high-income country by the World Bank. Because of its economic performance after the Soviet breakup, Estonia has been termed one of the Baltic Tigers.
In 2008, Estonia was ranked 12th of 162 countries in the Index of Economic Freedom 2008, the best of any former Soviet republic. The same year, the country was on bottom of Europe by labour market freedom, but the government is drafting improvements. Estonia is 21st on the Ease of Doing Business Index 2013 by the World Bank Group.
The Government of Estonia decided that the country should adopt the euro as its official currency, and finalized the design of Estonian euro coins in late 2004. The switchover to the euro took place on 1 January 2011, later than planned, because continued high inflation had prevented it from fulfilling the entry criteria earlier. The Estonian kroon was pegged to the euro at a rate of 15.64664 EEK to one euro.
The Financial Crisis of 2008 has had a grave effect on the Estonian economy, primarily as a result of an investment and consumption slump that followed the bursting of the real estate market bubble that had been building up during the preceding years. Estonia had the EU's worst year for unemployment, which rose from 3.9% in May 2008 to 15.6% in May 2009.
Nevertheless, long-term prospects for the Estonian economy remain among the most promising in Europe. In 2011, the real GDP growth in Estonia was 8.0%, and according to the projections made by the CEPII, by 2025 the GDP per capita could rise to the level of Nordic economies of Sweden, Finland, Denmark, and Norway. According to the same projections, by 2050, Estonia could become the most productive country in the EU, after Luxembourg, and thus join the top five most productive nations in the world.
| Economy of Estonia | |
|---|---|

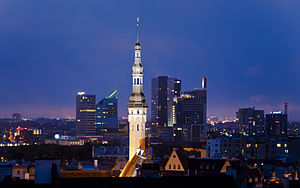
Tornimäe business area in Tallinn
| |
| Rank | 98th (nominal) / 113th (PPP) |
| Currency | Euro (EUR) |
| Fiscal year | Calendar year |
| Trade organisations | EU, WTO and OECD |
| Statistics | |
| GDP | |
| GDP growth | |
| GDP per capita | |
| GDP by sector | agriculture 3.7%, industry 30.2%, services 66.1% (2012 est.) |
| Inflation (CPI) | |
| Population below poverty line |
17.5% – income below €299/month (2011) |
| Gini coefficient | 31.3 (2010) |
| Labour force | 675,900 (2012 est.) |
| Labour force by occupation |
agriculture 4.2%, industry 20.2%, services 75.6% (2010) |
| Unemployment | |
| Average gross salary | €865, or ca. $1,162, monthly (4th quarter of 2011) |
| Main industries | engineering, electronics, wood and wood products, textiles; information technology, telecommunications |
| Ease of doing business rank | 21st |
| External | |
| Exports | |
| Export goods | machinery and electrical equipment 21%, wood and wood products 9%, metals 9%, furniture 7%, vehicles and parts 5%, food products and beverages 4%, textiles 4%, plastics 3% |
| Main export partners | |
| Imports | |
| Import goods | machinery and electrical equipment, mineral fuels, chemical products, foodstuffs, plastics, textiles |
| Main import partners | |
| FDI stock | |
| Gross external debt. | |