IMF..............................................WB............................................................CIA
rank/measure.............................rank/measure..............................................rank/measure
31/22,771.............................-/na..............................................................29/27,746
Oil and natural gas are the basis of Bahrain 's Economy. A large refinery processes oil from Saudi arabia as well as Bahrain's own oil. Other industries are being developed including aluminium smelting and ship building and repair. The Government is also developing Bahrain's traditional role as an international trading port and banking centre.

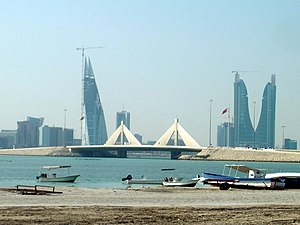
Bahrain skyline
| |
| Currency | Bahraini dinar (BHD) |
|---|---|
| Fiscal year | Calendar Year |
| Trade organisations | OPEC, GCC |
| Statistics | |
| GDP | $33.63 billion (2012 est.) |
| GDP growth | 3.91% (2012 est.) |
| GDP per capita |
$29,200
(PPP) (2012 est.) |
| GDP by sector | Agriculture (0.4%), Industry (51.3%), Services (48.4%) (2012 est.) |
| Inflation (CPI) | 2.8% (2012 est.) |
| Labour force | 705,900 |
| Labour force by occupation | Agriculture (1%), Industry (79%), Services (20%) (1997 est.) |
| Unemployment | 3.8% (2010 est.) |
| Main industries | Petroleum Processing and Refining,Aluminum Smelting, Iron Pelletization,Fertilizers, Islamic and Offshore Banking,Insurance, Ship Repairing, Tourism |
| Ease of doing business rank | 42nd |
| External | |
| Exports | $21.4 billion (2012 est.) |
| Export goods | Petroleum and Petroleum Products,Aluminum, Textiles |
| Main export partners | |
| Imports | $15.17 billion (2012 est.) |
| Import goods | Crude Oil, Machinery, Chemicals |
| Main import partners | |